Thursday, August 17, 2017

Interstellar travel routes

In many SF settings, one would like to see the routes used to travel between stars. Celestia's "Asterisms" feature can be used to draw lines between stars, but it has limitations. All of the lines are the same color, for example.

nroutes.celx is a Celestia script which creates a .CMOD model of lines, each drawn between any pair of Celestia objects, any color you want, and with their visibility potentially controllable by a Visibility setting.

https://www.classe.cornell.edu/~seb/celestia/files/nroutes.zip

(9KB expands to 15KB)

See its accompanying readme file for usage details.

Briefly, nroutes.celx reads a .csv file, each line (row) of which defines a separate route. You don't have to specify the RA, Dec and distances of their endpoints yourself, instead you specify object names which are known to Celestia. The script extracts their (cartesian ecliptic) coordinates from Celestia and uses those values to create a .cmod model file.

For example, one of the lines (rows) in the the .csv file used to specify a route between Alpha Centauri and Sirius could look like this:

ALF Cen,Sirius,1.0,1.0,0.0, alpha cen to sirius


The first two fields are the names of two Celestia objects which are the endpoints of the line. They can be any of the synonyms known to Celestia for any of its STC or DSC objects. The three numeric fields specify R, G and B values used to color the route line. The text following the 5th comma is ignored.

(In principle one could specify SSC object names, but they change position and the CMOD lines don't.)

The structure of the .csv is rather restrictive (e.g. no embedded blank lines or comment lines) but the script does not try to verify that you've entered the correct names or used the right line format. Either the script or Celestia will crash or the CMOD won't be drawn if the data is too badly messed up. In principle a lot of error detection could be added, but I just didn't feel like spending the time on it. Maybe some future version could do that. Or maybe someone else could make the appropriate changes to the script.


Interactive maps

Ilanthar of the Cartographers Guild has been posting some beautiful maps of his Resurgence stellar system in the threads https://www.cartographersguild.com/showthread.php?t=38300 and https://www.cartographersguild.com/showthread.php?t=38449

Although the maps that he's published have been static images, they give the impression that they're screengrabs from an interactive information display system. With his permission, I've started implementing a simplified version of that system, using Celestia as the platform.

Several Celestia Addons which add interactive features to his maps are now available on the Web at https://www.classe.cornell.edu/~seb/celestia/resurgence/

Here are a few screengrabs:


Sunday, July 2, 2017

Large Catalogs

Over the past few months I've been struggling with large star and galaxy catalogs, ones which typically include information for about 2 million objects. Here are some of my results.


Galaxies: SDSS DR13

 sdss_dr13_galaxies.zip (v0.9; 30MB expands to 37MB, 06Jun17)

This Addon provides views into the distribution of galaxies in the depths of space. 

Although their database of galaxies hasn't undergone significant modifications for several data releases, I extracted galaxy positions and Z values from the Sloan Digital Sky Survey's 13th Data Release to create this Celestia Addon.

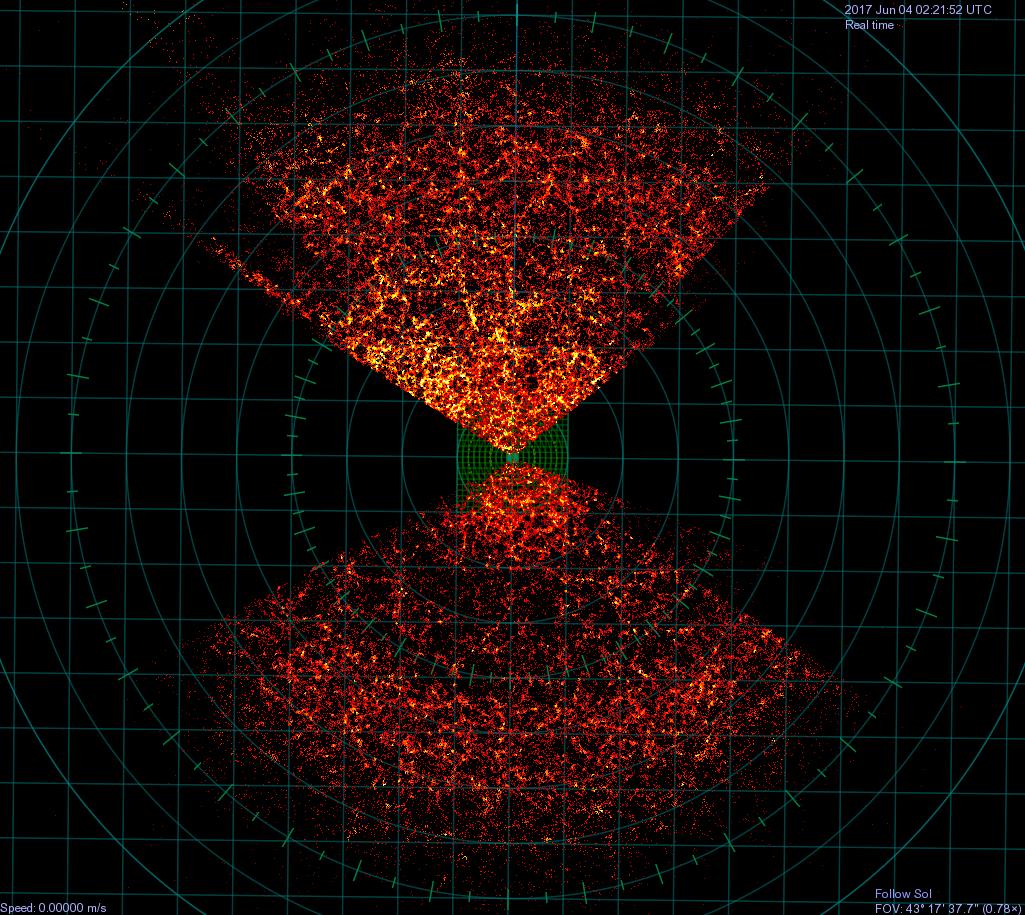
This first image shows Celestia displaying an equivalent of the SDSS Orange Pie image. (The original can be seen at http://www.sdss.org/science/orangepie/) It shows the positions of about 200,000 galaxies in a relatively thin layer, with Equatorial Declinations of +/- 1.5 degrees. Each dot representing a galaxy is colored proportionally to the local density of galaxies: red for low densities, through yellow, to white for the highest density.


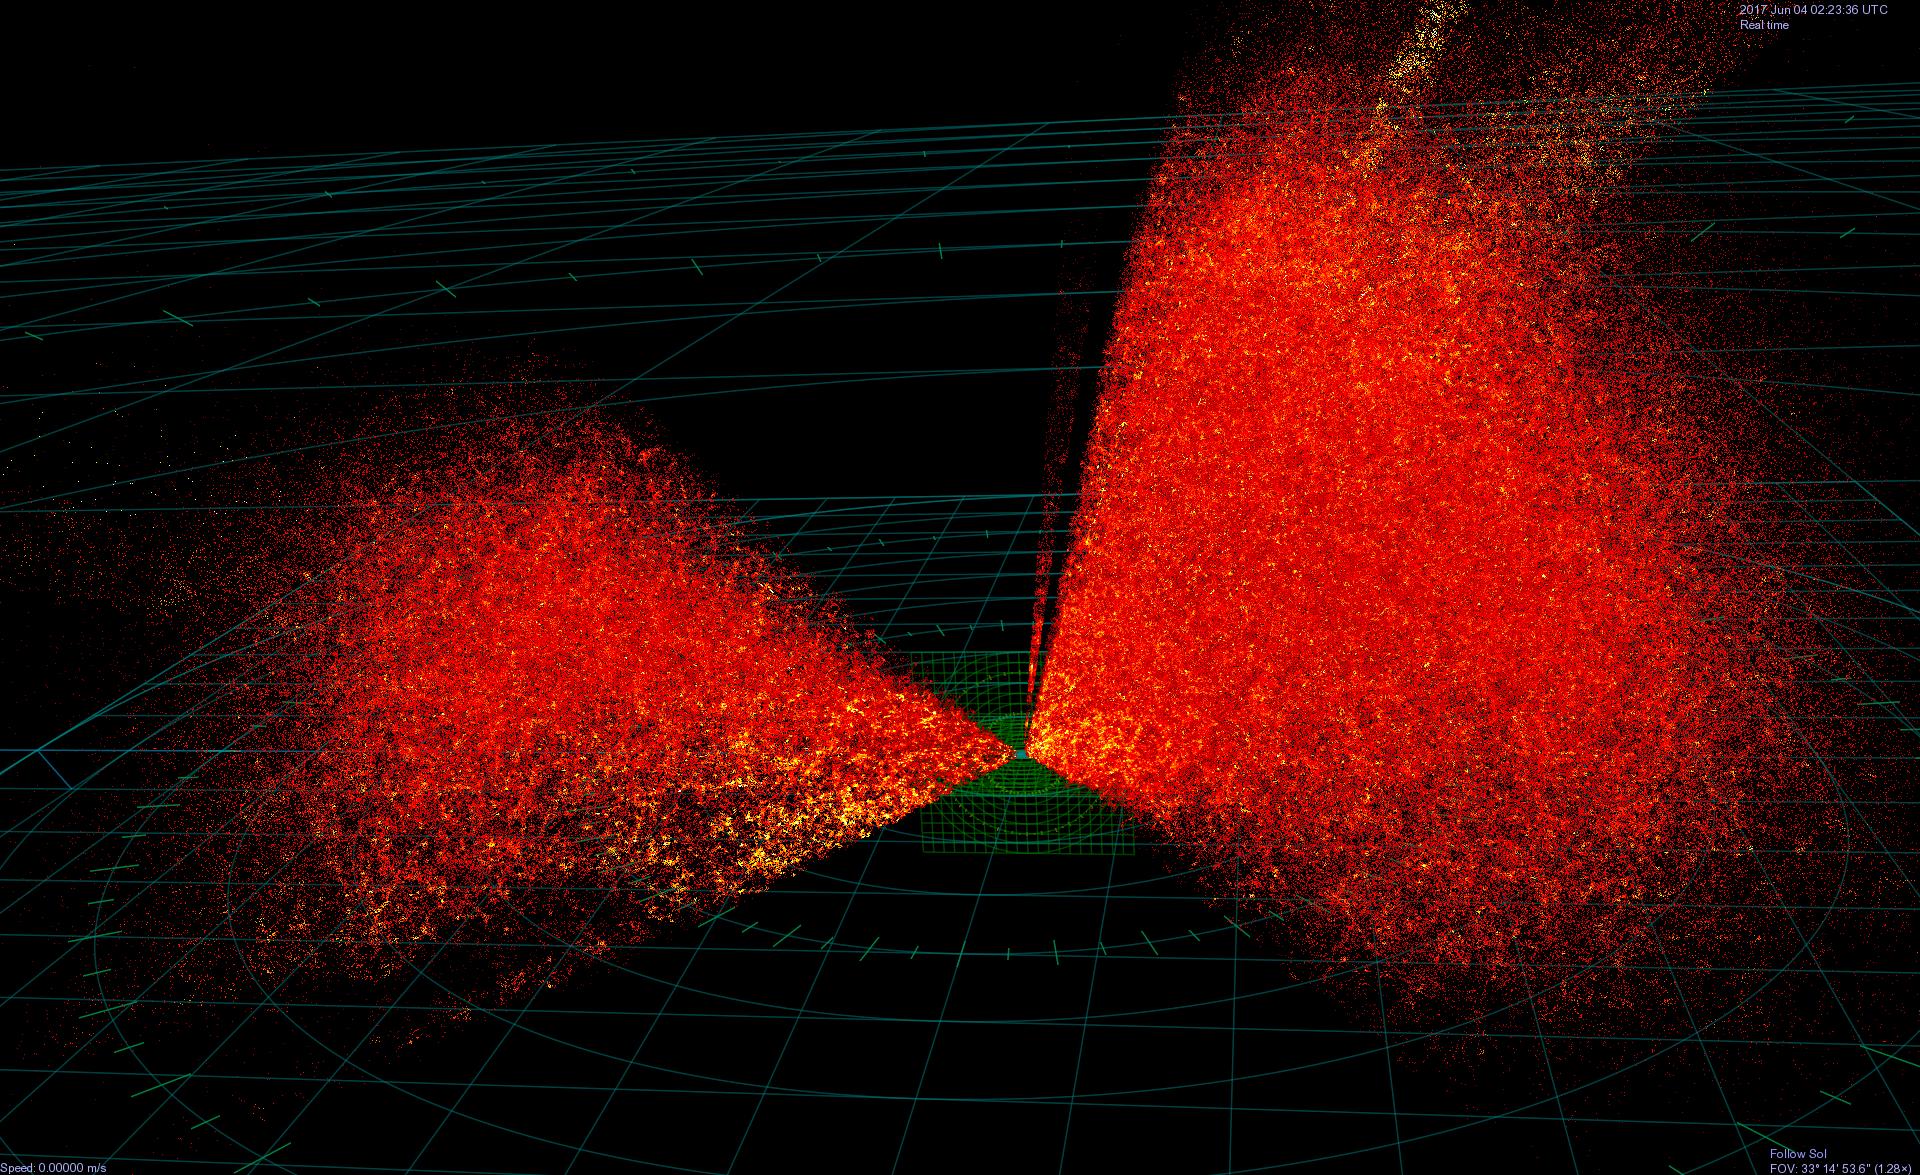
This second picture below shows approximately 2,000,000 galaxies.  Their conical  distributions are due to the limited regions of the sky in which the SDSS has done their measurements. For example, they avoid the regions of the sky obscured behind the stars and dust clouds of our own Milky Way galaxy.


These and other views are available in the Addon.


 Open Clusters

gaia_clusters_v2.zip (7.9 MB, expands to 10.3 MB, 14Jun17)

This Addon for Celestia v1.6.1 displays the positions of stars which are likely to be members of various open clusters. It includes a star database derived from Gaia DR1, defining the locations of 416,945 stars with parallax errors less than 10% of their parallax values. It also includes all-sky plots showing the relative coverage of Tycho-2, TGAS and this Addon's star databases.


Bright Stars

 OB_Stars.zip (404KB, expands to 2.8MB 04May17)

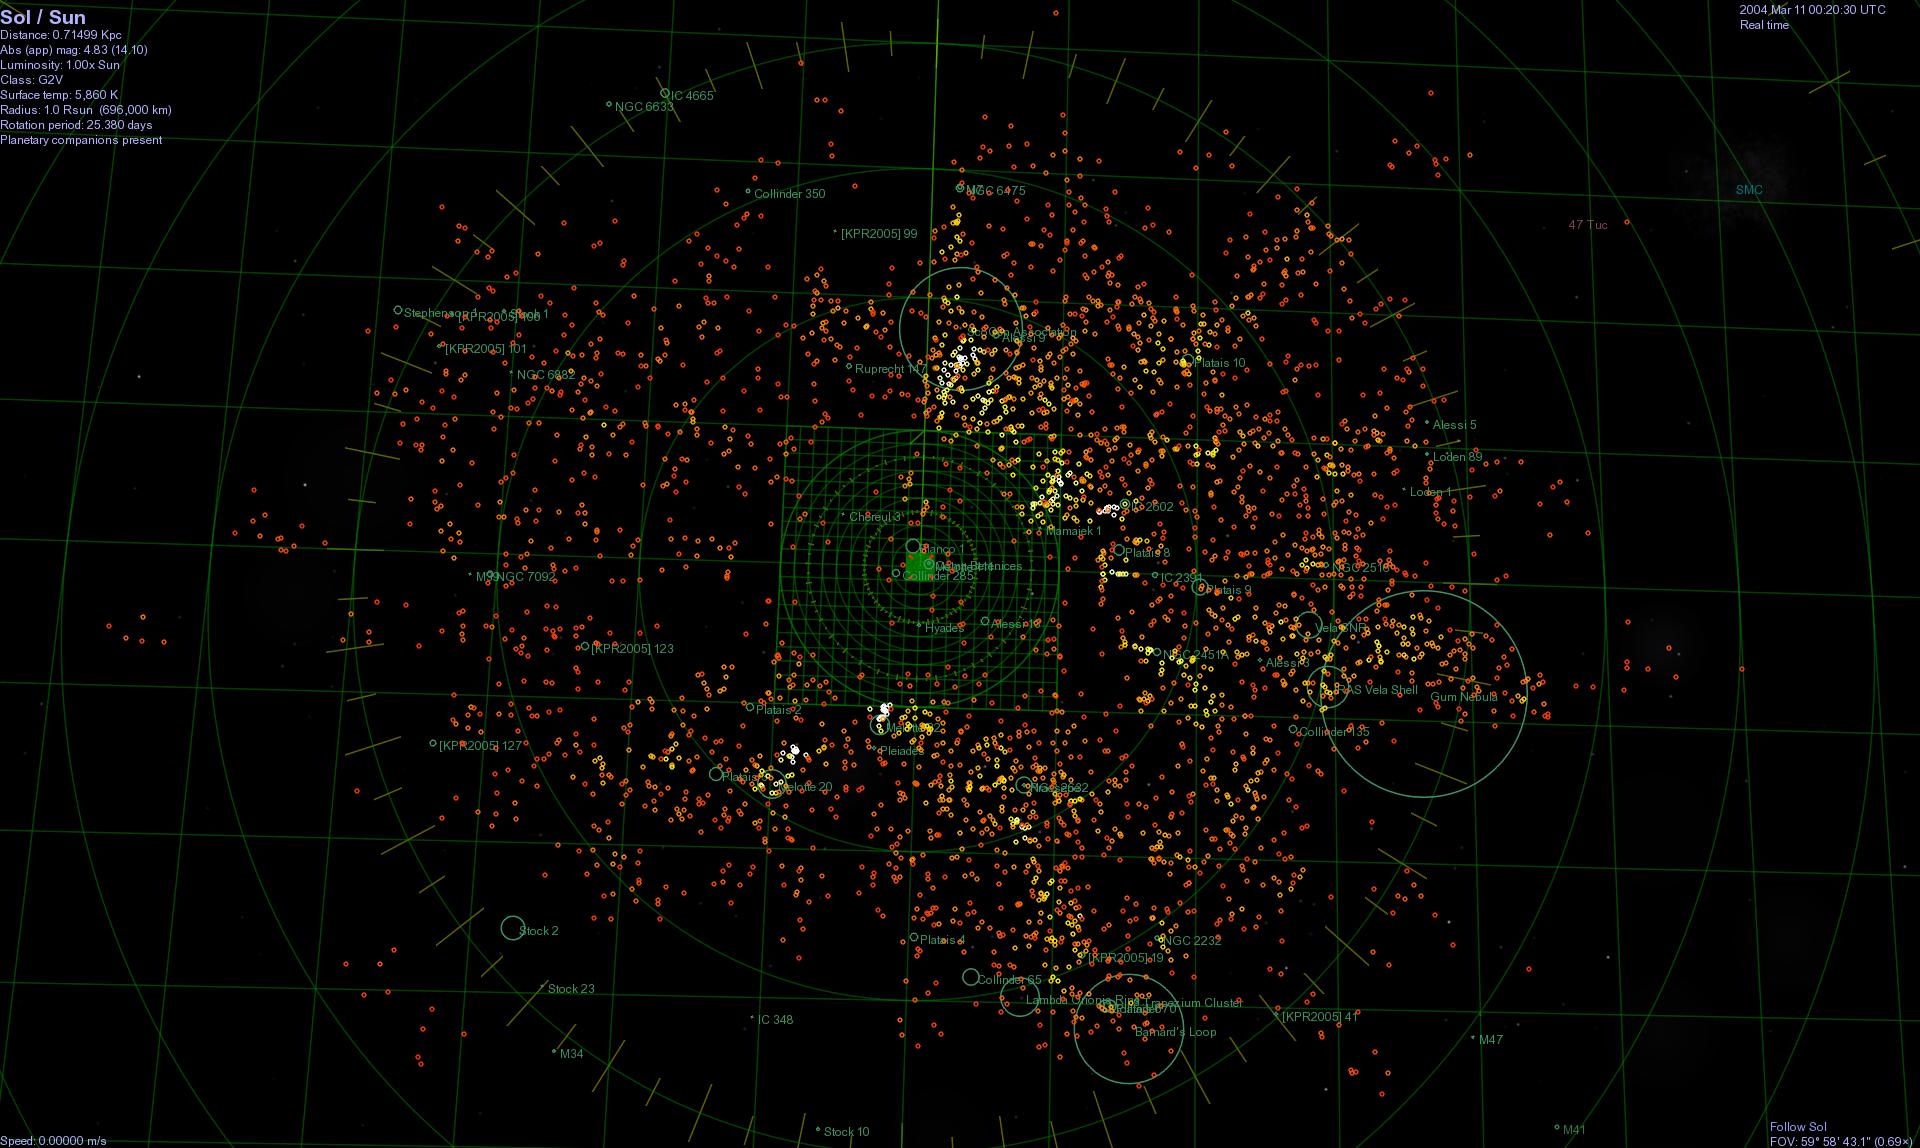
This Addon lets you display the density of the clouds of B stars within about 1500 LY. The colors of the marks vary from red (low density) through yellow (medium density) to white (high density).


If you squint, you can see a trail of bright marks (high star density) leading from our Sun down to the Orion Nebula, which is at the lower right. Toward the upper right you'll see vast OB Associations of young stars.